Math and Science Resources
|
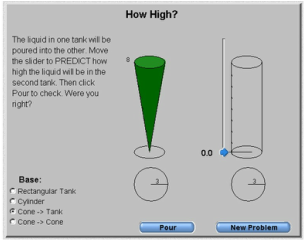
How High
Students will practice evaluating expressions by plugging values in to the formulas for geometric figures. This resource can accompany the Interactive Presentation Lesson Plan when students will practice evaluating formulas with replacement values. Virginia Standards of Learning: A.1 The student will represent verbal quantitative situations algebraically and evaluate these expressions for given replacement values of the variables. |
|
|
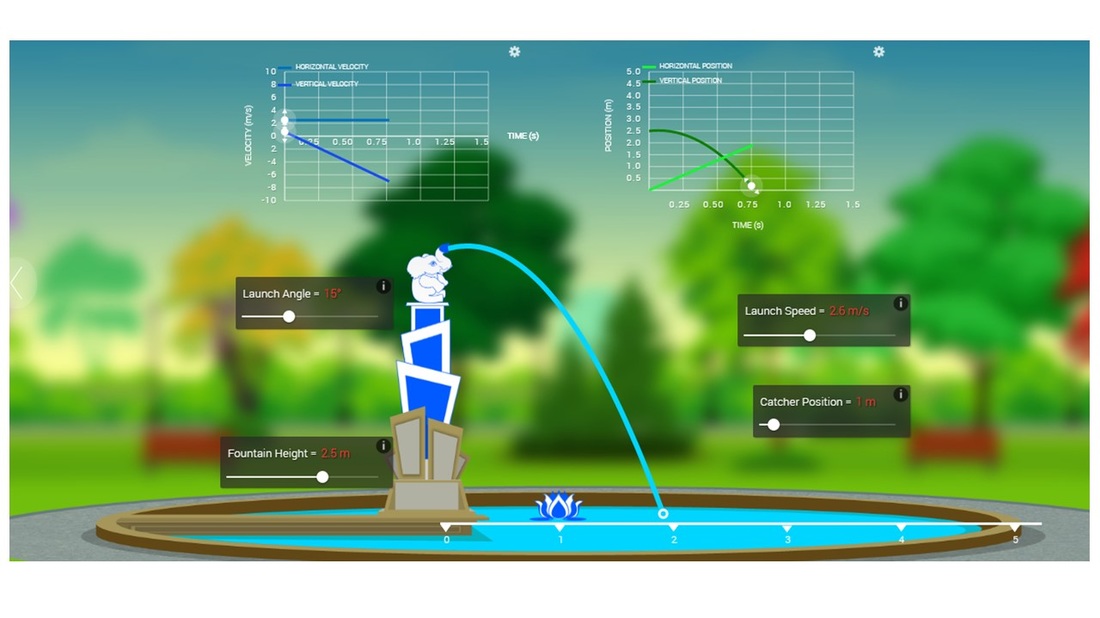
The Water Fountain
The water fountain simulation allows students to incorporate science concepts of speed and gravity with the geometry concept of angles and the algebraic concept of parabolas. Virginia Standards of Learning: A.4c The student will solve multistep linear and quadratic equations in two variables, including solving quadratic equations algebraically and graphically. |
|
|
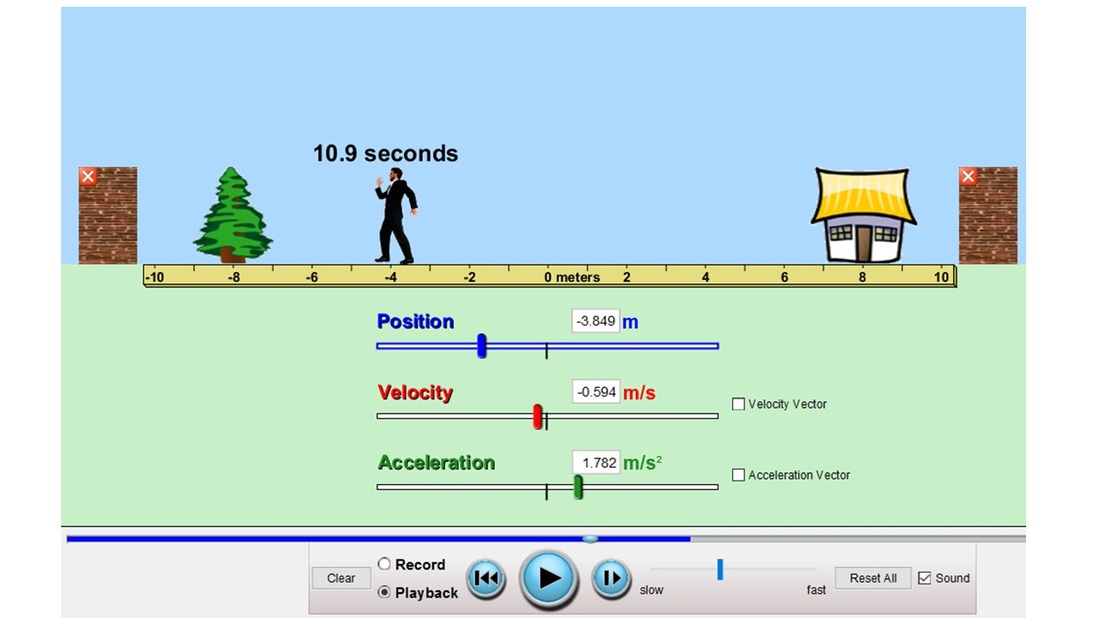
The Moving Man
Students will practice creating a graph of the distance versus time as the man moves on the simulation. This resource can accompany the Instructional Software Lesson Plan for students to analyze the slope of the graph they create. Virginia Standards of Learning: A.6a The student will graph linear equations and linear inequalities in two variables, including a) determining the slope of a line when given an equation of the line, the graph of the line, or two points on the line. Slope will be described as rate of change and will be positive, negative, zero, or undefined. |
|
|
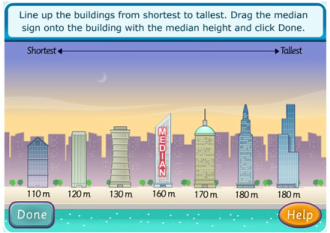
Mean, Median, Mode
Students will practice ordering to identify the median, creating a tally chart to identify the mode, and calculating the mean. This resource can accompany the Internet Enriched Lesson Plan when students will need to calculate the median prior to making a box and whisker plot. Virginia Standards of Learning: A.9 The student, given a set of data, will interpret variation in real-world contexts and calculate and interpret mean absolute deviation, standard deviation, and z-scores. A.10 The student will compare and contrast multiple univariate data sets, using box-and-whisker plots. |
|
|
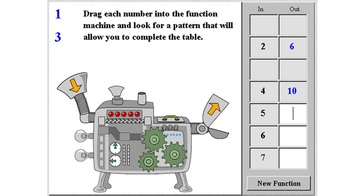
Function Machine
Students see the same rule in use repeatedly and then must develop the rule (the function equation) to help them fill in the missing output values for the table. Virginia Standards of Learning: A.7e The student will investigate and analyze function (linear and quadratic) families and their characteristics both algebraically and graphically, including finding the values of a function for elements in its domain |
|
|
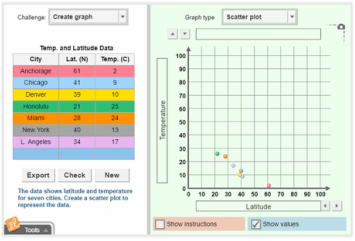
Scatterplot
Students will practice graphing on the coordinate plane and then develop the regression equation for the line of best fit. This resource can accompany the Instructional Software Lesson about slope as a rate of change when the class discusses linear regression. Virginia Standards of Learning: A.11 The student will collect and analyze data, determine the equation of the curve of best fit in order to make predictions, and solve real-world problems, using mathematical models. Mathematical models will include linear and quadratic functions. |
|
|
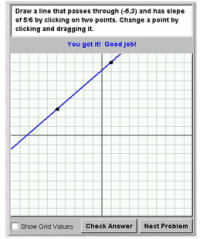
Line Plotter
Students practice graphing a line that passes through the required point with the given slope and can then check if their answer is correct. This resource can accompany the Instructional Software Lesson about slope as a rate of change to additional examples and practice, if needed. Virginia Standards of Learning: A.6a The student will graph linear equations and linear inequalities in two variables, including a) determining the slope of a line when given an equation of the line, the graph of the line, or two points on the line. Slope will be described as rate of change and will be positive, negative, zero, or undefined. |
|
|
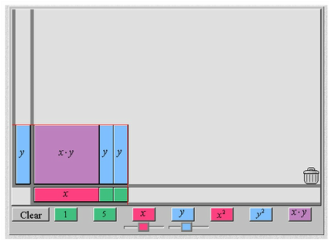
Algebra Tiles
Students can use a visual representation of the abstract algebraic concepts for multiplying and factoring. Virginia Standards of Learning: A.2b The student will perform operations on polynomials, including adding, subtracting, multiplying, and dividing polynomials A.2c The student will perform operations on polynomials, including factoring completely first- and second-degree binomials and trinomials in one or two variables. |
|
|
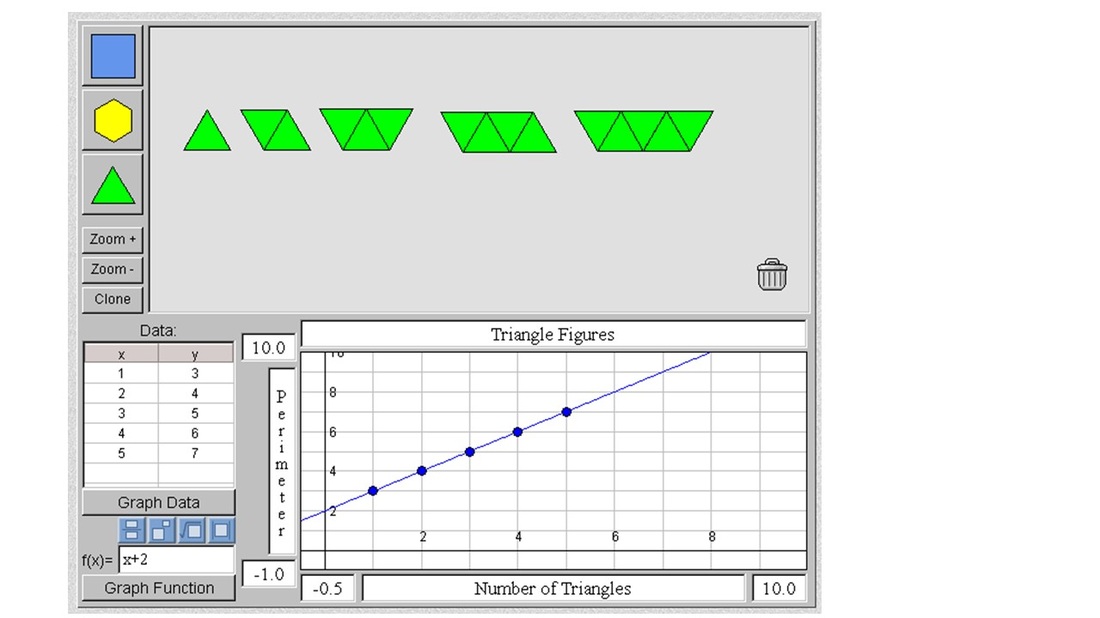
Pattern Blocks
Students must count the perimeter of the figures and then write an algebraic function to represent the pattern. They also can graph the table of data and the function to confirm their equation. This resource can be used to tie in with the Game-Based Learning lesson for graphing a line prior to moving into the systems of equations. Virginia Standards of Learning: A.6b The student will graph linear equations and linear inequalities in two variables, including writing the equation of a line when given the graph of the line, two points on the line, or the slope and a point on the line. |
|
|
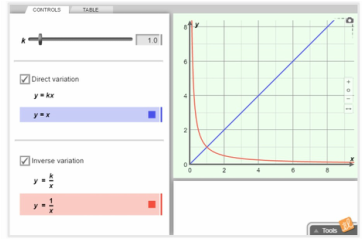
Direct and Inverse Variation
Students can adjust the constant of variation to see how it affects the graph of a direct of inverse variation. Virginia Standards of Learning: A.8 The student, given a situation in a real-world context, will analyze a relation to determine whether a direct or inverse variation exists, and represent a direct variation algebraically and graphically and an inverse variation algebraically. |
|
|
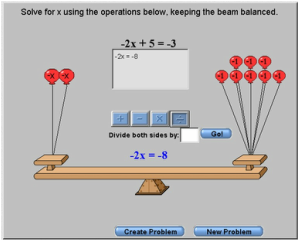
Algebra Balance Scales
Students need to use the idea of balancing the scale while they solve the algebra equation. This promotes a visualization of the concept with positive and negative values. Virginia Standards of Learning: A.4d The student will solve multistep linear and quadratic equations in two variables, including solving multistep linear equations algebraically and graphically. |
|
|
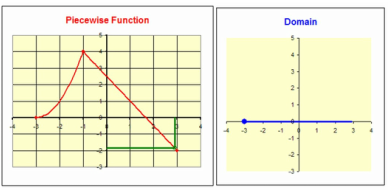
Domain and Range Demonstration
A visual representation showing the development of domain and range restrictions through tracing a graph. Virginia Standards of Learning: A.7b The student will investigate and analyze function (linear and quadratic) families and their characteristics both algebraically and graphically, including domain and range. |
|
|
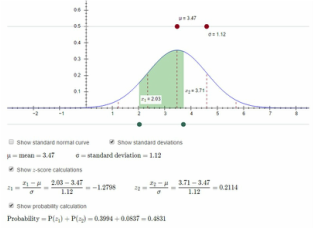
Normal Probability Distribution
Students are able to choose and manipulate 2 boundary points on the Normal Distribution (bell curve) in order to visually see changes in the z-score and the resulting probability under the curve. This resource can accompany the Social Networking Lesson to help students calculate the z-score and probability (area under the curve) for their data. Virginia Standards of Learning: A.9 The student, given a set of data, will interpret variation in real-world contexts and calculate and interpret mean absolute deviation, standard deviation, and z-scores. |
|
|
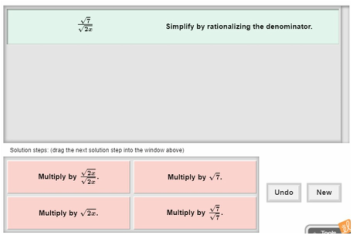
Simplest Radical Form
Students have to select the next step in the process one line of work at a time. This resource can accompany the Video Enhanced Lesson for students to check their understanding about simplest radical form. Virginia Standards of Learning: A.3 The student will express the square roots and cube roots of whole numbers and the square root of a monomial algebraic expression in simplest radical form. |
|
|
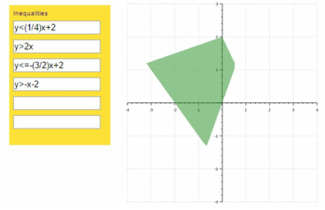
Graphing Linear Inequalities
Students have the opportunity to input various inequalities and see the resulting graph. This resource can follow-up the Game-Based Learning Lesson for students to graph a system of inequalities. Virginia Standards of Learning: A.5d The student will solve multistep linear inequalities in two variables, including solving systems of inequalities. |
|
|
NCTM Illuminations
Lessons for teachers and interactive demonstrations for students produced by the National Council for Teachers of Mathematics. |

|
|
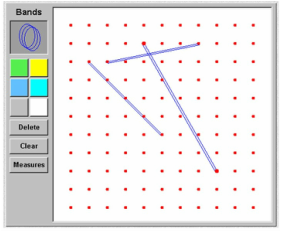
Geoboards
Students can manipulate bands on the online geoboard to count perimeter, area, and slope. This can be used along with the Instructional Software Lesson Plan about slope as a rate of change. Virginia Standards of Learning: A.6a The student will graph linear equations and linear inequalities in two variables, including a) determining the slope of a line when given an equation of the line, the graph of the line, or two points on the line. Slope will be described as rate of change and will be positive, negative, zero, or undefined. |
|
|
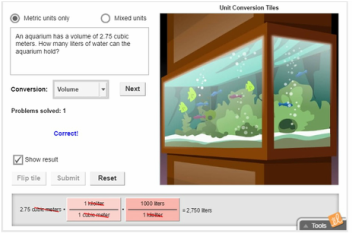
Unit Conversion (Dimensional Analysis)
Interactive simulation and tutorial for converting units in distance, volume, time, speed, mass, or density that can focus on metric units or mix metric and U.S. units. |
|
|
|
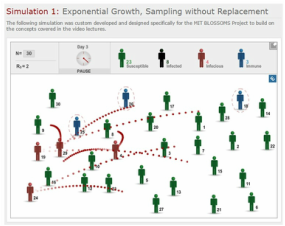
Exponential Spread of Disease
This simulation shows how the flu can spread from patient zero in an exponential fashion. |
|
